Market concentrationFinding
~85%
Home-market dependence
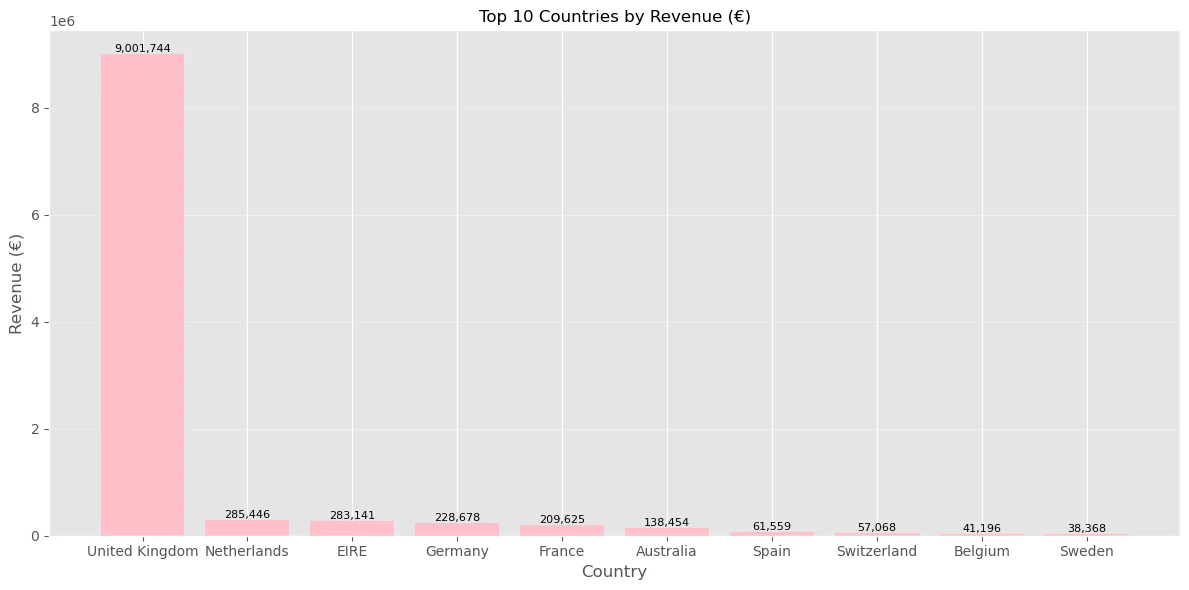
The United Kingdom contributes roughly 85% of reported positive gross sales, creating a clear concentration risk.
Python & Data Analytics · Interactive Reporting
More than half a million transaction lines cleaned, modelled and translated into an interactive management dashboard prototype.
View the full project report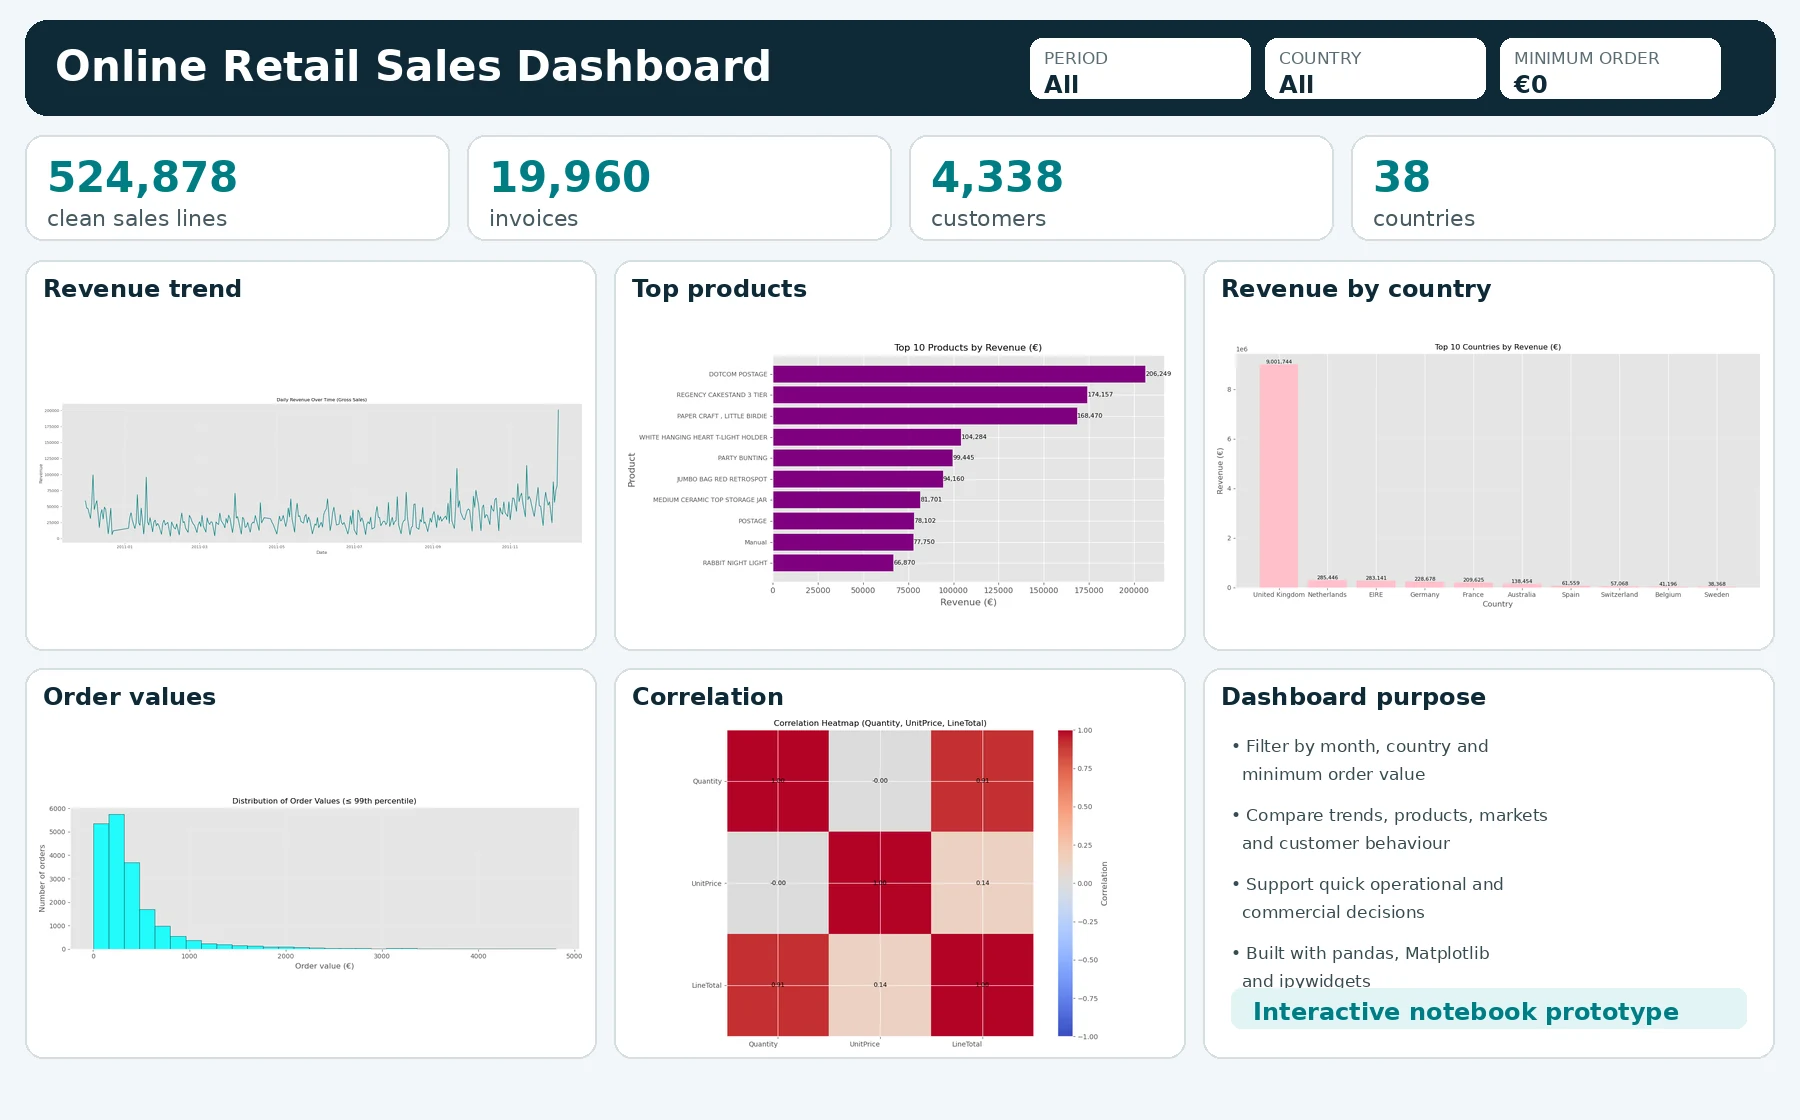
I started with line-level invoice data from a UK-based non-store retailer. I audited its quality, removed exact duplicates, separated positive sales from returns or invalid rows and engineered the fields needed for revenue and order analysis.
Where is revenue coming from, which products and markets matter most, and how are order values distributed over time? The final reporting model was designed to give a non-technical manager clear answers without requiring them to edit the analysis code.
Returns and cancellations were excluded, so this project reports positive gross sales rather than net revenue. Customer-level analysis is also limited by 135,080 missing CustomerID values in the raw data.
Analysis workflow
Checked missing values, exact duplicates, invalid sales and extreme quantities or prices before charting.
Removed 5,268 duplicates and 11,763 non-positive rows, converted dates and created line revenue fields.
Aggregated line data into 19,960 invoices with order value, quantity, product-line and period measures.
Connected month, country and minimum-order filters to reusable chart refresh logic in Jupyter.
Exploratory analysis
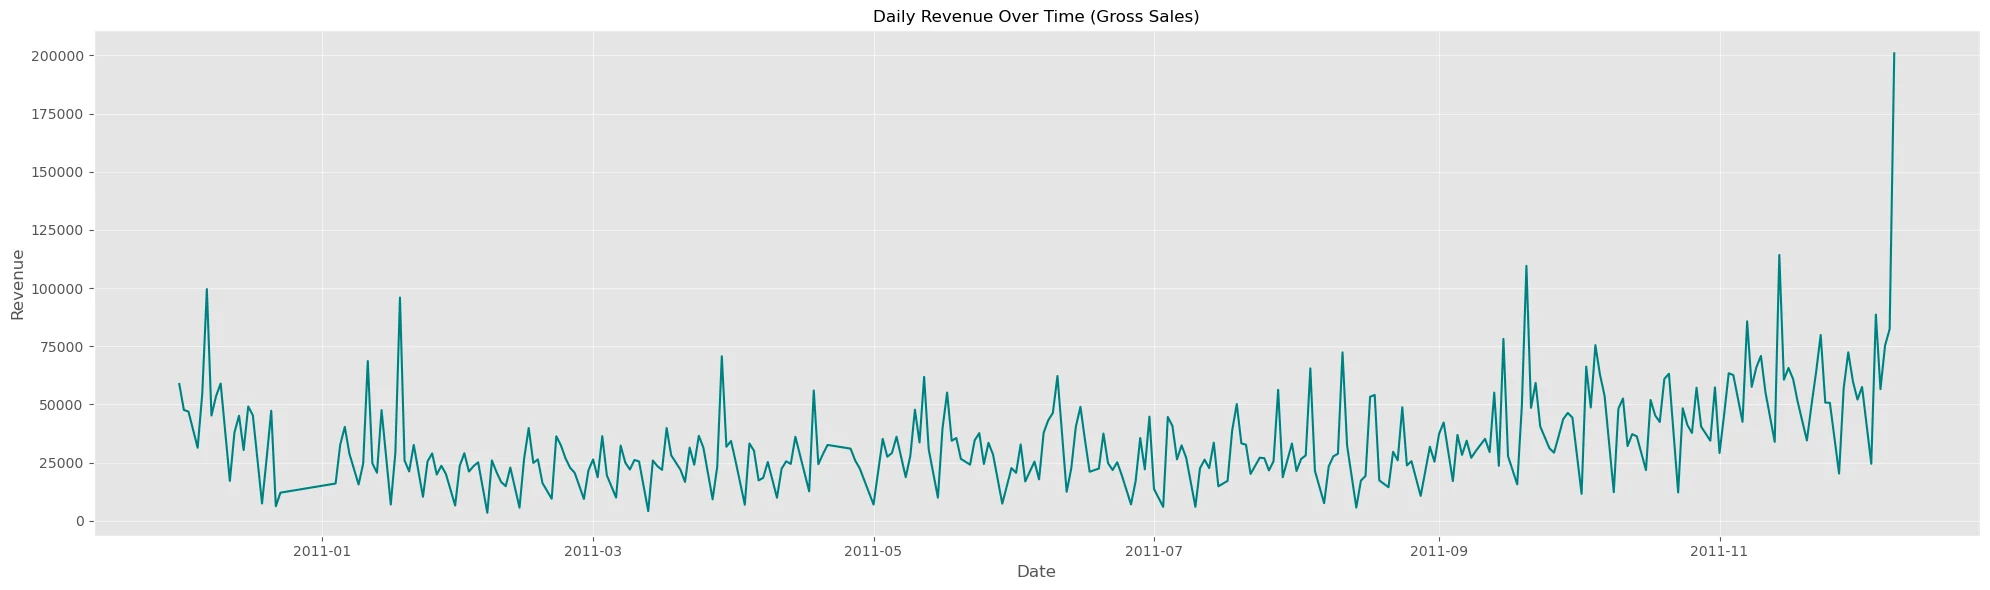
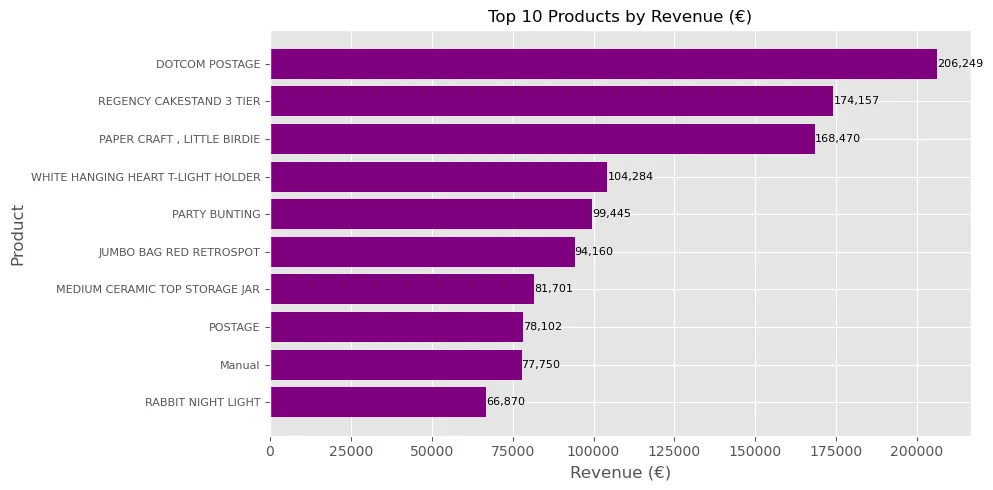
The visual choices match the business question: a line for time, horizontal bars for product ranking and columns for market comparison.
Key findings
The project connects each finding to a practical commercial or operational question instead of presenting charts without context.
The United Kingdom contributes roughly 85% of reported positive gross sales, creating a clear concentration risk.
Quantity has a strong positive correlation with line revenue, while unit price has a much weaker relationship.
The main order-value view was capped at the 99th percentile so typical orders remained readable beside wholesale outliers.
Business value
Recommended next steps
Plan stock and staffing around the stronger final quarter, separate service codes from merchandise reporting, segment small and high-value orders, and investigate repeatable demand in leading international markets. A future version could add returns, margin data, RFM analysis and a deployed browser dashboard.
Technology used
Next case study
AI Waste Classification →